We can monitor AKS cluster using many ways. We will monitor AKS cluster using Azure Log Analytics workspace which collects log data and metrics from AKS cluster and stores them inside workspace. We will use Grafana for visualizing the data from Log Analytics workspace.

Watch steps in YouTube channel:
Different ways of Monitoring AKS Cluster
- Monitoring AKS cluster using Azure Log Analytics Workspace and Grafana
- Monitoring AKS cluster using Prometheus/Grafana
- Monitoring AKS cluster using Azure Monitor
What is Azure Log Analytics Workspace?
Azure Log Analytics workspace is a logical storage unit in Azure where all log data generated by Azure Monitors are stored. Log Analytics workspace collects log data from various Azure resources such as Azure Virtual machine or Azure Kubernetes Service. You can think of the workspace as a folder where all your monitoring data is stored and managed.
What is Grafana?
- Grafana is an open source visualization and analytics tool.
- It allows you to query, visualize, alert on, and explore your metrics no matter where they are stored.
Pre-requisites:
- Azure subscription, click here if you don't have one.
- Install Azure CLI on your local machine
- Install Helm
- Install kubectl
But we will try creating a new AKS cluster and monitor.
Make sure you are login to Azure portal first.
az login
enter your Microsoft credentials.
az login
Create a resource group first
az group create --name myResourceGroup --location southcentralus
Create Log Analytics workspace

az monitor log-analytics workspace create --resource-group myResourceGroup \
--workspace-name my-loganalytics-workspace \
--query id \
-o tsv

Output of the above command will display log analytics Id which is needed for next command while creating AKS cluster. we will be associating Log Analytics Workspace ID with AKS Cluster during creation.
Create AKS cluster with 2 worker nodes with Monitoring Enabledaz aks create --resource-group myResourceGroup --name myAKSCluster --node-count 2 --enable-addons monitoring --workspace-resource-id /subscriptions/XXXXX/resourceGroups/myResourceGroup/providers/Microsoft.OperationalInsights/workspaces/aks-loganalytics-workspace
Verify all the resources are created in Azure Portal
Click on resource group name, you will see AKS cluster, log analytics workspace

Display Details of Cluster
az aks show --name myAKSCluster --resource-group myResourceGroup
The above command will display AKS Cluster details.
az monitor log-analytics workspace create --resource-group myResourceGroup \
--workspace-name my-loganalytics-workspace \
--query id \
-o tsv
az aks create --resource-group myResourceGroup --name myAKSCluster --node-count 2 --enable-addons monitoring --workspace-resource-id /subscriptions/XXXXX/resourceGroups/myResourceGroup/providers/Microsoft.OperationalInsights/workspaces/aks-loganalytics-workspace
Verify all the resources are created in Azure Portal
Click on resource group name, you will see AKS cluster, log analytics workspace

Display Details of Cluster
az aks show --name myAKSCluster --resource-group myResourceGroup
The above command will display AKS Cluster details.
Connect to the cluster
az aks get-credentials --resource-group myResourceGroup --name myAKSCluster --overwrite-existing

To verify the connection to your cluster, use the kubectl get command to return a list of the cluster nodes.
kubectl get nodes

Connect to the cluster
az aks get-credentials --resource-group myResourceGroup --name myAKSCluster --overwrite-existing
To verify the connection to your cluster, use the kubectl get command to return a list of the cluster nodes.
kubectl get nodes
Permission needed (SPN) to pull metrics Data from Azure Log Analytics
We need to create Service principal(SPN) and assign Log Analytics Reader Role on the AKS Cluster ResourceGroup. Execute below command to first get resource group ID where AKS cluster is running.
First Let's get Resource Group ID
az group show --name myResourceGroup --query id --output tsv
output of the above command will be resource group ID.
Create a Service Principal and Assign Role
 az ad sp create-for-rbac --role="Log Analytics Reader" --scopes="/subscriptions/xxxxxx-xxxx-xxxx-xxxxx/resourceGroups/myResourceGroup"
Creating 'Log Analytics Reader' role assignment under scope '/subscriptions/XXX/resourceGroups/myResourceGroup'
{
"appId": "xxx",
"displayName": "azure-cli-2023-04-12-22-06-28",
"password": "xxx",
"tenant": "xxx"
}
"appId": "xxx",
"displayName": "azure-cli-2023-04-12-22-06-28",
"password": "xxx",
"tenant": "xxx"
}
Note all the information above and save it.
Grafana Installation steps on AKS cluster using Helm
Install Grafana
helm repo add grafana https://grafana.github.io/helm-charts
helm search repo grafana
Create Monitoring namespace
kubectl create namespace monitoring

Create Monitoring namespace
kubectl create namespace monitoring
Install Grafana alone(NOT kube-prometheus-stack)
helm install stable grafana/grafana -n monitoring
 Lets check if grafana pods are running
kubectl get pods -n monitoring


kubectl get pods -n monitoring
Expose Grafana
# Port forward the Grafana service
kubectl port-forward -n monitoring stable-grafana-XXX 3000

How to get Grafana admin password by querying pod
kubectl get secret --namespace monitoring stable-grafana -o jsonpath="{.data.admin-password}" | base64 --decode ; echo

Login to Grafana
Now Open localhost:3000 in browser to access Grafana

UserName: admin Password: <from the above command>
Create Data Source in Grafana
Go to Grafana, configuration and click Data Sources. Click on Add Data Source and search for Azure Monitor.


Enter tenant id, app id and secret information. click on Load subscriptions. Click on Save and Test.

Create Dashboard in Grafana


In Grafana, we can create various kinds of dashboards as per our needs.
How to Create Azure Monitor For Containers Dashboard?
Click '+' button on left panel and select ‘Import’.
Enter 10956 dashboard id under Grafana.com Dashboard.
Click ‘Load’.

Click ‘Import’.

This will show monitoring dashboard for all cluster nodes

Click '+' button on left panel and select ‘Import’.
Enter 10956 dashboard id under Grafana.com Dashboard.
Click ‘Load’.

Click ‘Import’.

This will show monitoring dashboard for all cluster nodes

How to Create POD Metrics for AKS Dashboard?
Click '+' button on left panel and select ‘Import’.
Enter 14891 dashboard id under Grafana.com Dashboard.
Click ‘Load’.
Click '+' button on left panel and select ‘Import’.
Enter 14891 dashboard id under Grafana.com Dashboard.
Click ‘Load’.

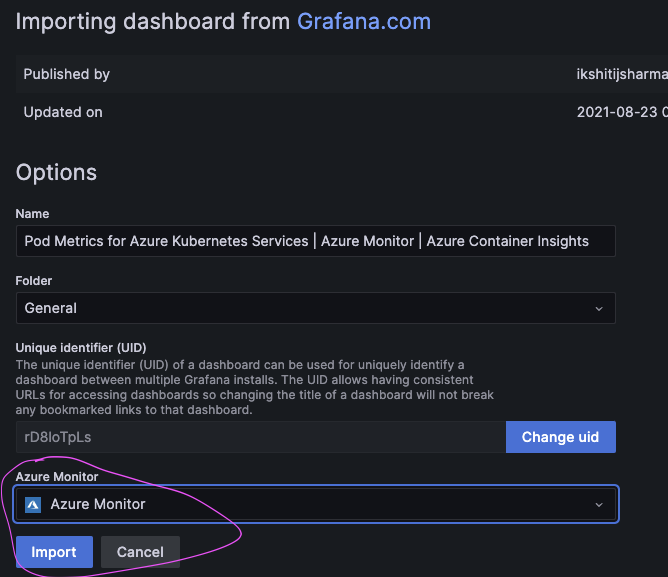
This will show monitoring dashboard for all pods, you can also select namespaces as well.

Clean up Resources
Let's see how to clean up the resources that were created. We can use the az group delete command to remove the resource group, AKS cluster, and all related resources.
az group delete --name myResourceGroup --yes --no-wait
Clean up Resources
Let's see how to clean up the resources that were created. We can use the az group delete command to remove the resource group, AKS cluster, and all related resources.
az group delete --name myResourceGroup --yes --no-wait
Click here for Script for Creating AKS cluster with Monitoring Enabled.