Showing posts with label EKS. Show all posts

Sunday, September 4, 2022

Deploy Springboot Microservices App into Amazon EKS Cluster using Jenkins Pipeline and Kubectl CLI Plug-in | Containerize Springboot App and Deploy into EKS Cluster using Jenkins Pipeline

We will learn how to automate springboot microservices builds using Jenkins pipeline and Deploy into AWS EKS Cluster with help of Kubernetes CLI plug-in.

We will use Springboot Microservices based Java application. I have already created a repo with source code + Dockerfile. The repo also have Jenkinsfile for automating the following:

- Automating builds using Jenkins
- Automating Docker image creation
- Automating Docker image upload into AWS ECR
- Automating Docker Containers Deployments to Kubernetes Cluster


Watch steps in YouTube channel:

Same Code for this video is here:

Pre-requisites:
1. Amazon EKS Cluster is setup and running. Click here to learn how to create Amazon EKS cluster.
5. Docker, Docker pipeline and Kubernetes CLI plug-ins are installed in Jenkins


6. Install kubectl on your instance

Step # 1 - Create Maven3 variable under Global tool configuration in Jenkins
Make sure you create Maven3 variable under Global tool configuration. 


Step #2 - Create Credentials for connecting to Kubernetes Cluster using kubeconfig
Click on Add Credentials, use Kubernetes configuration from drop down.

use secret file from drop down.


execute the below command to login as jenkins user.
sudo su - jenkins

you should see the nodes running in EKS cluster.

kubectl get nodes


Execute the below command to get kubeconfig info, copy the entire content of the file:
cat /var/lib/jenkins/.kube/config


Open your text editor or notepad, copy and paste the entire content and save in a file.
We will upload this file.

Enter ID as K8S and choose File and upload the file and save.


Enter ID as K8S and choose enter directly and paste the above file content and save.

Step # 3 - Create a pipeline in Jenkins
Create a new pipeline job.


Step # 4 - Copy the pipeline code from below
Make sure you change red highlighted values below as per your settings:
Your docker user id should be updated.
your registry credentials ID from Jenkins from step # 1 should be copied

pipeline {
   tools {
        maven 'Maven3'
    }
    agent any
    environment {
        registry = "account_id.dkr.ecr.us-east-2.amazonaws.com/my-docker-repo"
    }
   
    stages {
        stage('Cloning Git') {
            steps {
                checkout([$class: 'GitSCM', branches: [[name: '*/main']], doGenerateSubmoduleConfigurations: false, extensions: [], submoduleCfg: [], userRemoteConfigs: [[credentialsId: '', url: 'https://github.com/akannan1087/springboot-app']]])     
            }
        }
      stage ('Build') {
          steps {
            sh 'mvn clean install'           
            }
      }
    // Building Docker images
    stage('Building image') {
      steps{
        script {
          dockerImage = docker.build registry 
        }
      }
    }
   
    // Uploading Docker images into AWS ECR
    stage('Pushing to ECR') {
     steps{  
         script {
                sh 'aws ecr get-login-password --region us-east-2 | docker login --username AWS --password-stdin account_id.dkr.ecr.us-east-2.amazonaws.com'
                sh 'docker push account_id.dkr.ecr.us-east-2.amazonaws.com/my-docker-repo:latest'
         }
        }
      }

       stage('K8S Deploy') {
        steps{   
            script {
                withKubeConfig([credentialsId: 'K8S', serverUrl: '']) {
                sh ('kubectl apply -f  eks-deploy-k8s.yaml')
                }
            }
        }
       }
    }
}

Step # 5 - Build the pipeline
Once you create the pipeline and changes values per your configuration, click on Build now:
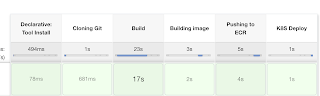

Step # 6 - Verify deployments to K8S

kubectl get pods


kubectl get deployments

kubectl get services


Steps # 7 - Access SpringBoot App in K8S cluster
Once build is successful, go to browser and enter master or worker node public ip address along with port number mentioned above
http://loadbalancer_ip_address

You should see page like below:


Note:

and make changes in eks-deploy-k8s.yaml to pull Docker image from your AWS ECR repo.

Thursday, May 26, 2022

How to setup monitoring on Kubernetes Cluster using Prometheus and Grafana | Setup monitoring on EKS Cluster using Prometheus and Grafana


What is Prometheus?

  • Prometheus is an open source monitoring tool
  • Provides out-of-the-box monitoring capabilities for the Kubernetes container orchestration platform. It can monitor servers and databases as well.
  • Collects and stores metrics as time-series data, recording information with a timestamp 
  • It is based on pull and collects metrics from targets by scraping metrics HTTP endpoints.

What is Grafana?

  • Grafana is an open source visualization and analytics software. 
  • It allows you to query, visualize, alert on, and explore your metrics no matter where they are stored.
Please Watch this steps in YouTube Channel:

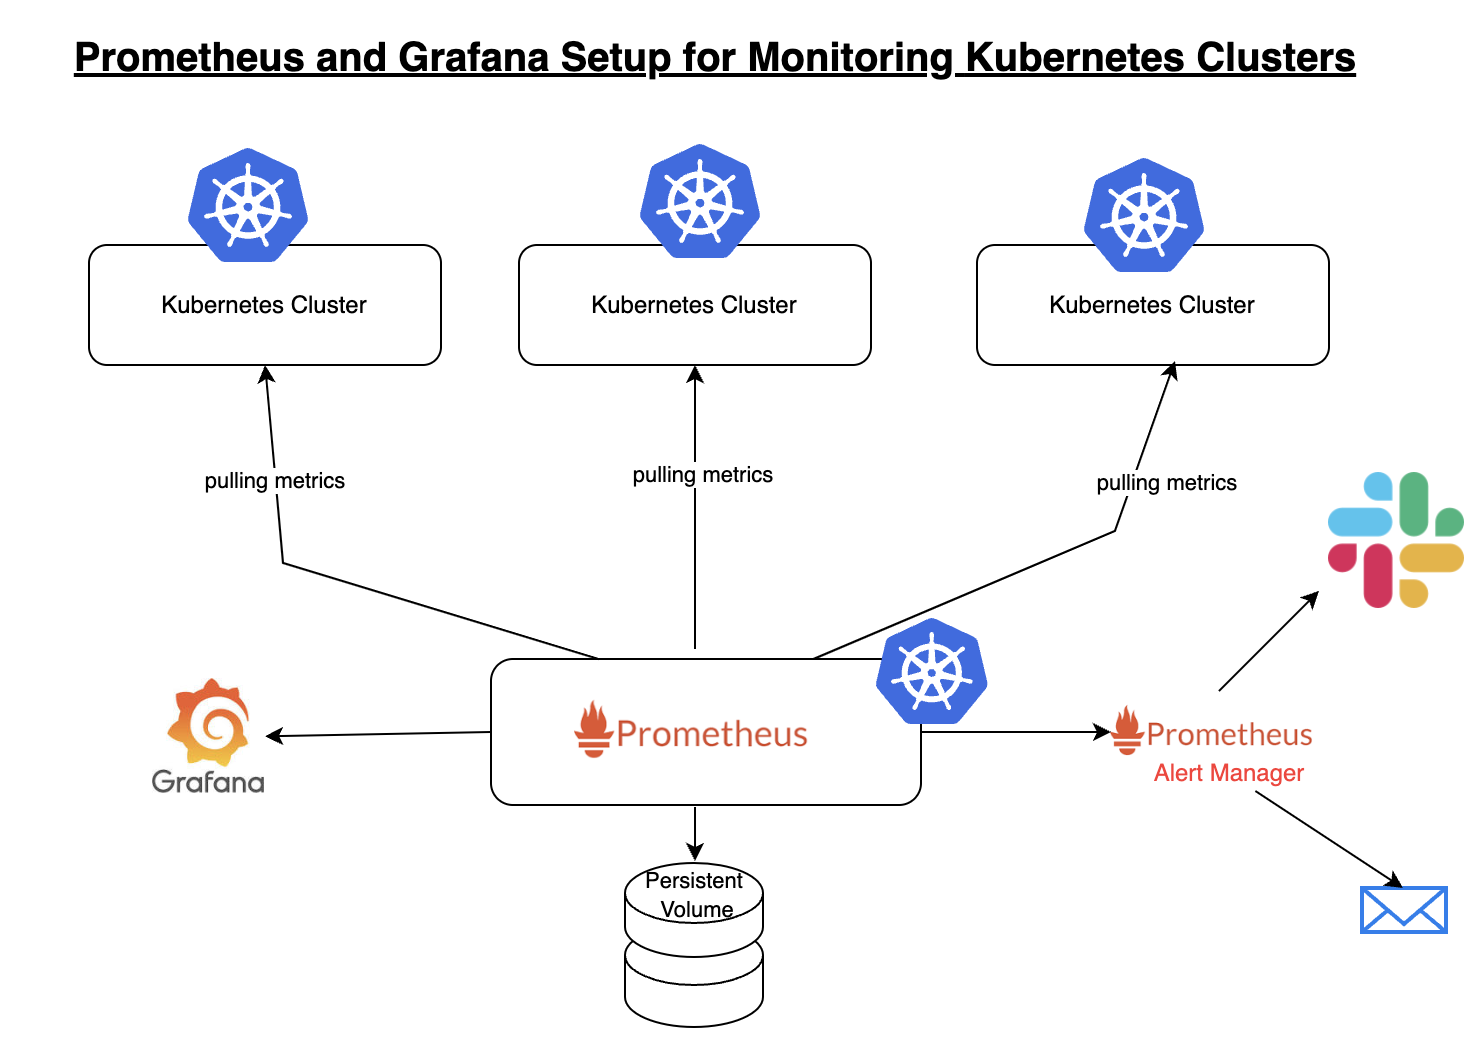
Prometheus Architecture


Key components:

    1. Prometheus server - Processes and stores metrics data
    2. Alert Manager - Sends alerts to any systems/channels
    3. Grafana - Visualize scraped data in UI

Installation Method

The are are many ways you can setup Prometheus and Grafana. You can install in following ways:

1. Create all configuration files of both Prometheus and Grafana and execute them in right order.

2. Prometheus Operator - to simplify and automate the configuration and management of the Prometheus monitoring stack running on a Kubernetes cluster

3. Helm chart (Recommended) - Using helm to install Prometheus Operator including Grafana

Why to use Helm?

Helm is a package manager for Kubernetes. Helm simplifies the installation of all components in one command. Install using Helm is recommended as you will not be missing any configuration steps and very efficient. 

Prerequisites

Implementation steps

We need to add the Helm Stable Charts for your local client. Execute the below command:

helm repo add stable https://charts.helm.sh/stable


# Add prometheus Helm repo
helm repo add prometheus-community https://prometheus-community.github.io/helm-charts


helm search repo prometheus-community

Prometheus and grafana helm chart moved to kube prometheus stack

Create Prometheus namespace
kubectl create namespace prometheus


Below is helm command to install kube-prometheus-stack. The helm repo kube-stack-prometheus (formerly prometheus-operator) comes with a grafana deployment embedded.

helm install stable prometheus-community/kube-prometheus-stack -n prometheus
Lets check if prometheus and grafana pods are running already

kubectl get pods -n prometheus


kubectl get svc -n prometheus


This confirms that prometheus and grafana have been installed successfully using Helm.

In order to make prometheus and grafana available outside the cluster, use load balancer or NodePort.

Edit Prometheus Service

kubectl edit svc stable-kube-prometheus-sta-prometheus -n prometheus

Edit Grafana Service

kubectl edit svc stable-grafana -n prometheus

Verify if service is changed to LoadBalancer and also to get the Load Balancer URL.

kubectl get svc -n prometheus


Access Grafana UI in the browser

Get the URL from the above screenshot and put in the browser


UserName: admin
Password: prom-operator

Create Dashboard in Grafana

In Grafana, we can create various kinds of dashboards as per our needs.

How to Create Kubernetes Monitoring Dashboard?

For creating a dashboard to monitor the cluster:


Click '+' button on left panel and select ‘Import’.

Enter 12740 dashboard id under Grafana.com Dashboard.

Click ‘Load’.

Select ‘Prometheus’ as the endpoint under prometheus data sources drop down.

Click ‘Import’.


This will show monitoring dashboard for all cluster nodes


How to Create Kubernetes Cluster Monitoring Dashboard?

For creating a dashboard to monitor the cluster:


Click '+' button on left panel and select ‘Import’.

Enter 3119 dashboard id under Grafana.com Dashboard.

Click ‘Load’.

Select ‘Prometheus’ as the endpoint under prometheus data sources drop down.

Click ‘Import’.

This will show monitoring dashboard for all cluster nodes


    Create POD Monitoring Dashboard

    For creating a dashboard to monitor the cluster:


    Click '+' button on left panel and select ‘Import’.

    Enter 6417 dashboard id under Grafana.com Dashboard.

    Click ‘Load’.

    Select ‘Prometheus’ as the endpoint under prometheus data sources drop down.

    Click ‘Import’.


    This will show monitoring dashboard for all cluster nodes.


    Monday, May 23, 2022

    error: exec plugin: invalid apiVersion "client.authentication.k8s.io/v1alpha1"

    Kubectl Error:

    you may get this error when ever you are running kubectl command

    error: exec plugin: invalid apiVersion "client.authentication.k8s.io/v1alpha1"

    Solution: 

    Make sure you update kubeconfig with below command:

    aws eks update-kubeconfig --name ${EKS_CLUSTER_NAME} --region ${REGION}


    Friday, February 4, 2022

    Create Amazon EKS cluster by eksctl | How to create EKS cluster in AWS cloud using eksctl | Create EKS Cluster in command line using IAM Role

    What is Amazon EKS

    Amazon EKS is a fully managed container orchestration service. EKS allows you to quickly deploy a production ready Kubernetes cluster in AWS, deploy and manage containerized applications more easily with a fully managed Kubernetes service.

    EKS takes care of master node/control plane. We need to create worker nodes.

    EKS cluster can be created in following different ways

    1. AWS console
    2. AWS CLI
    3. eksctl command
    4. using Terraform

    We will create EKS cluster using eksctl command line tool.

    Please watch the steps in YouTube channel:

    Pre-requistes:

    This Lab is using Jenkins EC2 instance. Jenkins EC2 instance needs to have following configured:

    • Install AWS CLI – Command line tools for working with AWS services, including Amazon EKS.

    • Install eksctl – A command line tool for working with EKS clusters that automates many individual tasks.

    • Install kubectl  – A command line tool for working with Kubernetes clusters. 

    Create IAM Role with Administrator Access

    You need to create an IAM role with AdministratorAccess policy.
    Go to AWS console, IAM, click on Roles. create a role


    Select AWS services, Click EC2, Click on Next permissions.
     
     Now search for AdministratorAccess policy and click


    Skip on create tag.
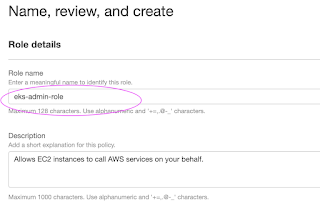
    Now give a role name and create it.

    Assign the role to EC2 instance
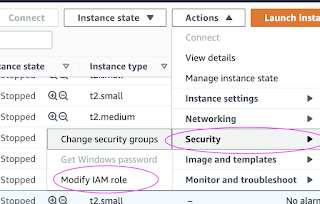
    Go to AWS console, click on EC2, select EC2 instance, Choose Security.
    Click on Modify IAM Role


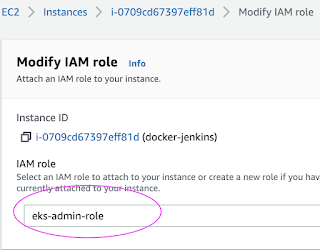
    Choose the role you have created from the dropdown.
    Select the role and click on Apply.

    Switch to Jenkins user
    sudo su - jenkins

    Create EKS Cluster with two worker nodes using eksctl

    eksctl create cluster --name demo-eks --region us-east-2 --nodegroup-name my-nodes --node-type t3.small --managed --nodes 2

    the above command should create a EKS cluster in AWS, it might take 15 to 20 mins. The eksctl tool uses CloudFormation under the hood, creating one stack for the EKS master control plane and another stack for the worker nodes. 

    Once EKS cluster is created, kubeconfig file be created under /var/lib/jenkins/.kube folder.

    you can view the kubeconfig file by entering the below command:

    cat  /var/lib/jenkins/.kube/config

    Connect to EKS cluster using kubectl commands

    To view the list of worker nodes as part of EKS cluster.

    kubectl get nodes

    kubectl get ns

    Deploy Nginx on a Kubernetes Cluster
    Let us run some apps to make sure they are deployed to Kubernetes cluster. The below command will create deployment:

    kubectl create deployment nginx --image=nginx


    View Deployments
    kubectl get deployments

    Delete EKS Cluster using eksctl

    eksctl delete cluster --name demo-eks --region us-east-2 

    the above command should delete the EKS cluster in AWS, it might take a few mins to clean up the cluster.

    Errors during Cluster creation
    If you are having issues when creating a cluster, try to delete the cluster by executing the below command and re-create it.

    eksctl delete cluster --name demo-eks --region us-east-2 


    or Login to AWS console --> AWS Cloud formation --> delete the stack manually.

    you can also delete the cluster under AWS console --> Elastic Kubernetes Service --> Clusters
    Click on Delete cluster