What is Prometheus?
- Prometheus is an open source monitoring tool
- Provides out-of-the-box monitoring capabilities for the Kubernetes container orchestration platform. It can monitor servers and databases as well.
- Collects and stores metrics as time-series data, recording information with a timestamp
- It is based on pull and collects metrics from targets by scraping metrics HTTP endpoints.
What is Grafana?
- Grafana is an open source visualization and analytics software.
- It allows you to query, visualize, alert on, and explore your metrics no matter where they are stored.
Prometheus Architecture
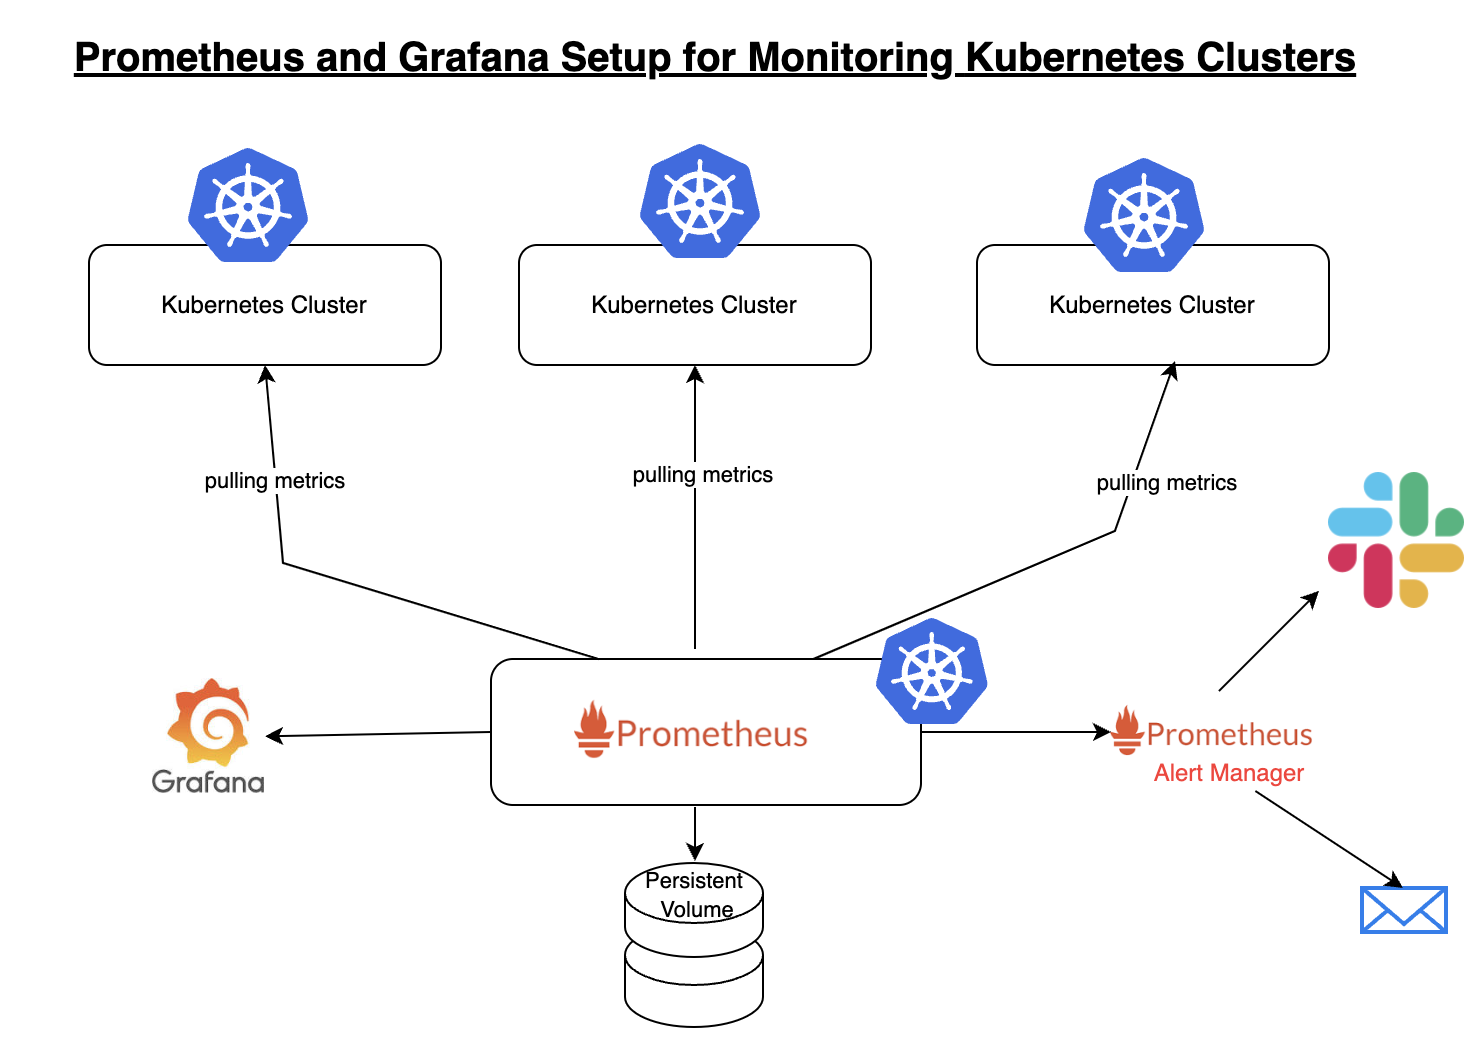
Key components:
Installation Method
The are are many ways you can setup Prometheus and Grafana. You can install in following ways:
1. Create all configuration files of both Prometheus and Grafana and execute them in right order.
2. Prometheus Operator - to simplify and automate the configuration and management of the Prometheus monitoring stack running on a Kubernetes cluster
3. Helm chart (Recommended) - Using helm to install Prometheus Operator including Grafana
Why to use Helm?
Helm is a package manager for Kubernetes. Helm simplifies the installation of all components in one command. Install using Helm is recommended as you will not be missing any configuration steps and very efficient.Prerequisites
- Kubernetes cluster is setup already
- Install Helm
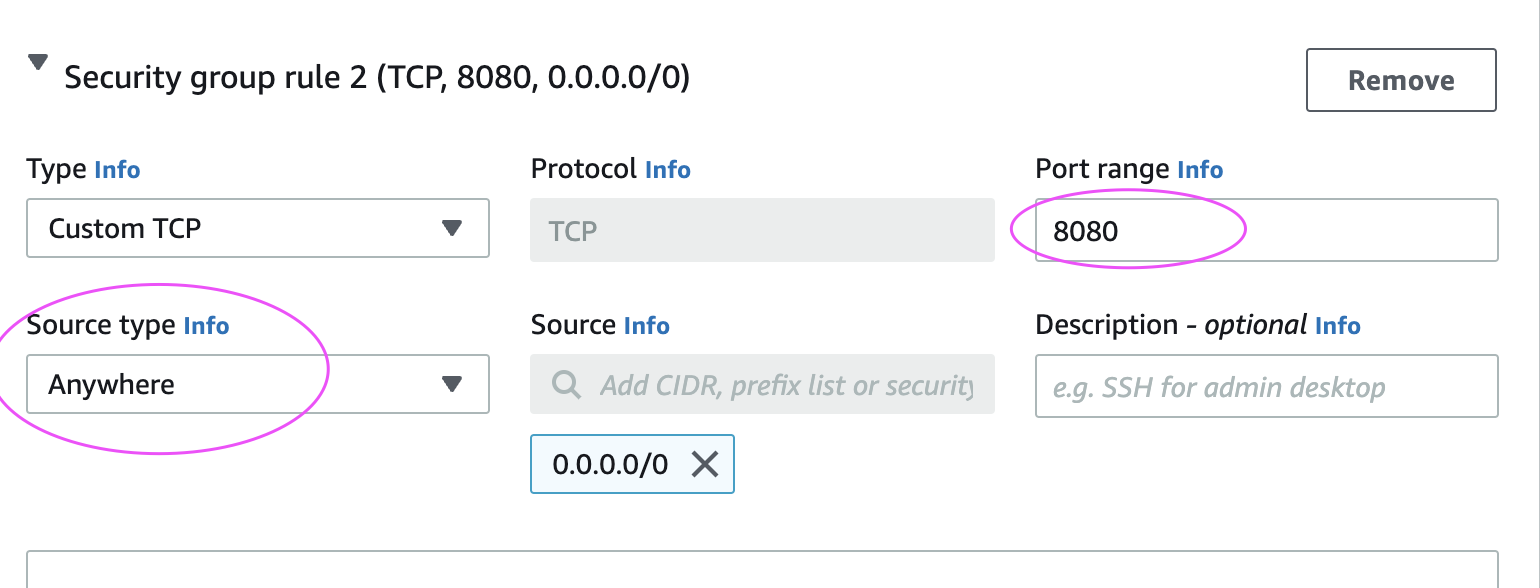
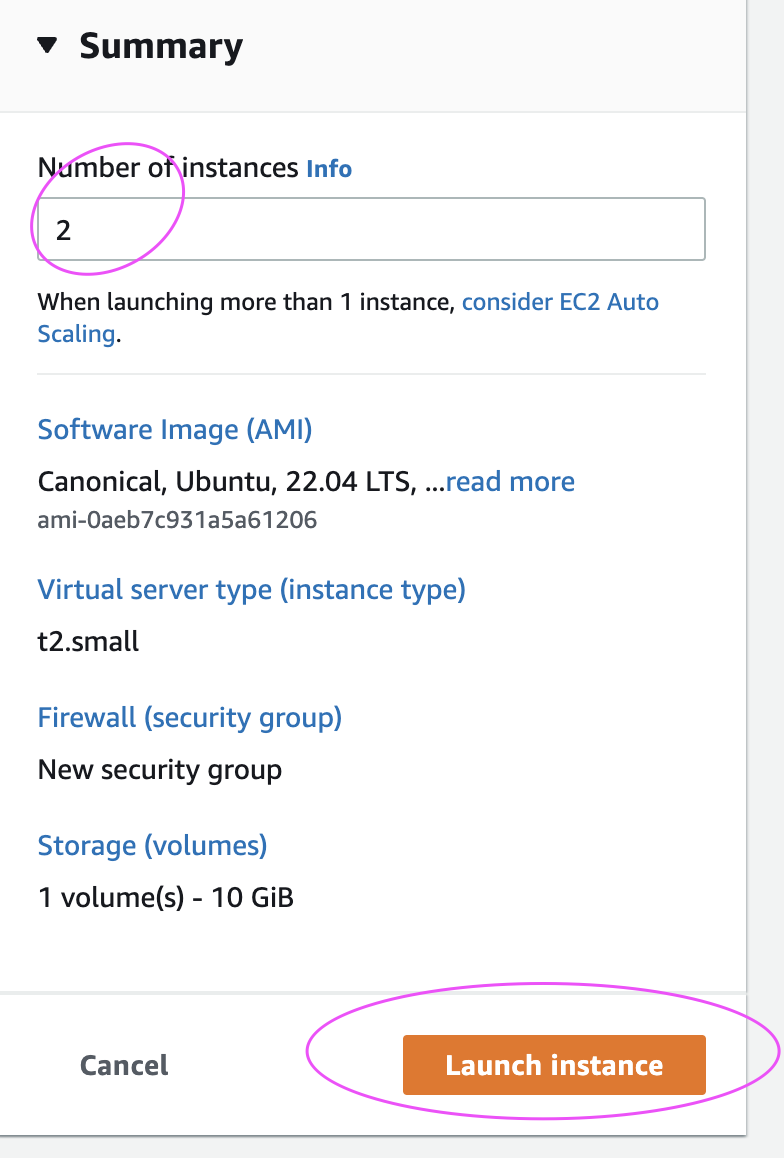
- EC2 instance to access EKS cluster
Implementation steps
We need to add the Helm Stable Charts for your local client. Execute the below command:
Prometheus and grafana helm chart moved to kube prometheus stack

Below is helm command to install kube-prometheus-stack. The helm repo kube-stack-prometheus (formerly prometheus-operator) comes with a grafana deployment embedded.

kubectl get pods -n prometheus

kubectl get svc -n prometheus

Edit Prometheus Service

Edit Grafana Service

kubectl get svc -n prometheus

How to Create Kubernetes Monitoring Dashboard?
For creating a dashboard to monitor the cluster:
Click '+' button on left panel and select ‘Import’.
Enter 12740 dashboard id under Grafana.com Dashboard.
Click ‘Load’.
Select ‘Prometheus’ as the endpoint under prometheus data sources drop down.
Click ‘Import’.
This will show monitoring dashboard for all cluster nodes

How to Create Kubernetes Cluster Monitoring Dashboard?
For creating a dashboard to monitor the cluster:
Click '+' button on left panel and select ‘Import’.
Enter 3119 dashboard id under Grafana.com Dashboard.
Click ‘Load’.
Select ‘Prometheus’ as the endpoint under prometheus data sources drop down.
Click ‘Import’.
This will show monitoring dashboard for all cluster nodes


Create POD Monitoring Dashboard
For creating a dashboard to monitor the cluster:
Click '+' button on left panel and select ‘Import’.
Enter 6417 dashboard id under Grafana.com Dashboard.
Click ‘Load’.
Select ‘Prometheus’ as the endpoint under prometheus data sources drop down.
Click ‘Import’.


This will show monitoring dashboard for all cluster nodes.